Distance/Velocity/Effort Charts
As you navigate each week of our Throwing Schedule, you’ll notice a gradual increase in distance, which naturally, will require a gradual increase in effort. Though we hope you are able to gauge this gradual progression through Self-Regulation, it’s also very helpful to have objective feedback, especially considering that you haven’t thrown a ball in 4-5 months or more.
It’s widely known that there is a noticeable difference between real and perceived effort. Therefore, the two charts below from data gathered by Ben Brewster/Tread Athletics will help you navigate these gradual transitions based on your pre-surgery maximum velocity in a bull-pen. The first chart, “Perceived Intensity Progression”, will show you from week to week the percentage of Perceived Intensity or effort you should be using based on the distance you cap out at in a given week. Once you establish your Perceived Intensity percentage, you can then look at the second, color coded chart below, “Target Velocity Ranges Based on Perceived Intensity”, which will calculate a mph range also based on your pre-surgery maximum velocity in a bull-pen setting.
For example, if you are in Week 6 of our Throwing Schedule, the maximum distance you will throw at is 60 feet. The “Perceived Intensity Chart” for this distance is 40-45%. Thus, if you look at the second chart, “Target Velocity Ranges Based on Perceived Intensity”, you’ll see that 40-45% Perceived Intensity based on your pre-surgery, maximum bull-pen velocity corresponds with a given range based on radar readings (you’ll notice in the Chart that there are 6 different Tiers of pre-surgery maximum velocity: 75 mph, 80 mph, 85 mph, 90 mph, 95 mph, and 100 mph). Therefore, if your pre-surgery max velocity was 85 mph, our suggested radar readings at 60 feet would be between 49-55 mph.
These two charts can be used throughout the first 21 Weeks of our Throwing Schedule as you progressively increase your distance, and thus, effort. Once you get to Week 22, we feel that you will have a much deeper understanding of the “feel” and “rhythm” of this progression so much so that you will be able to comfortably Self-Regulate your feel and effort. Keep in mind that this Chart is meant to be a starting point, as there are many variables that influence these numbers. We’d also recommend that you err on the side of throwing with less, rather than more velocity within each range. Be sure and consult with both your Medical Professionals and Pitching Coach.
Chart #1: Perceived Intensity Progression
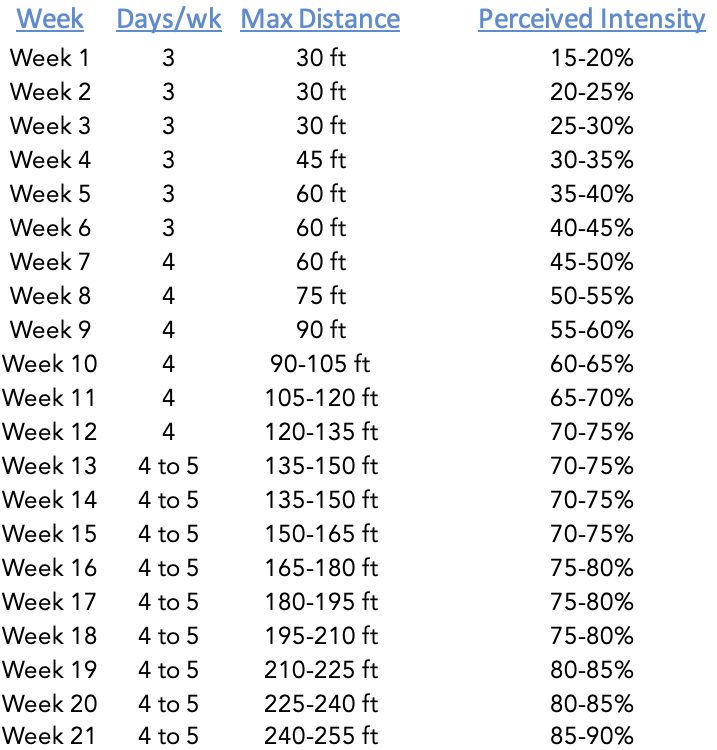
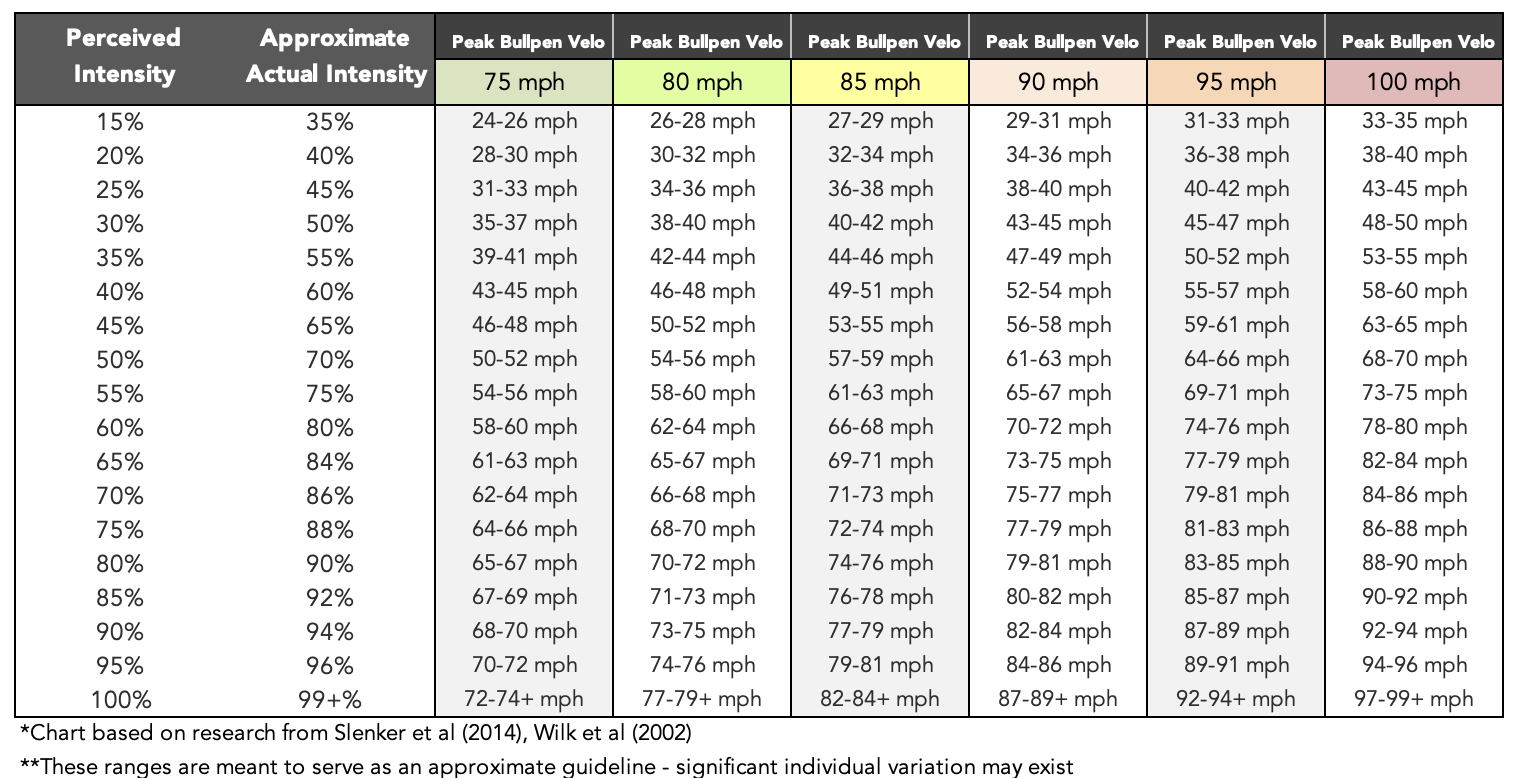
Chart #2: Target Velocity Ranges Based on Perceived Intensity
This chart shows the approximate relationship between perceived intensity & actual intensity. Based on knowing an athlete’s bullpen velocity, you can use this chart to identify target velocity ranges given the desired effort level called for in your throwing program. This chart is meant to be a starting point, as there are many variables that influence these numbers. Always defer to a coach or rehab professional to tailor any throwing program to your specific needs.